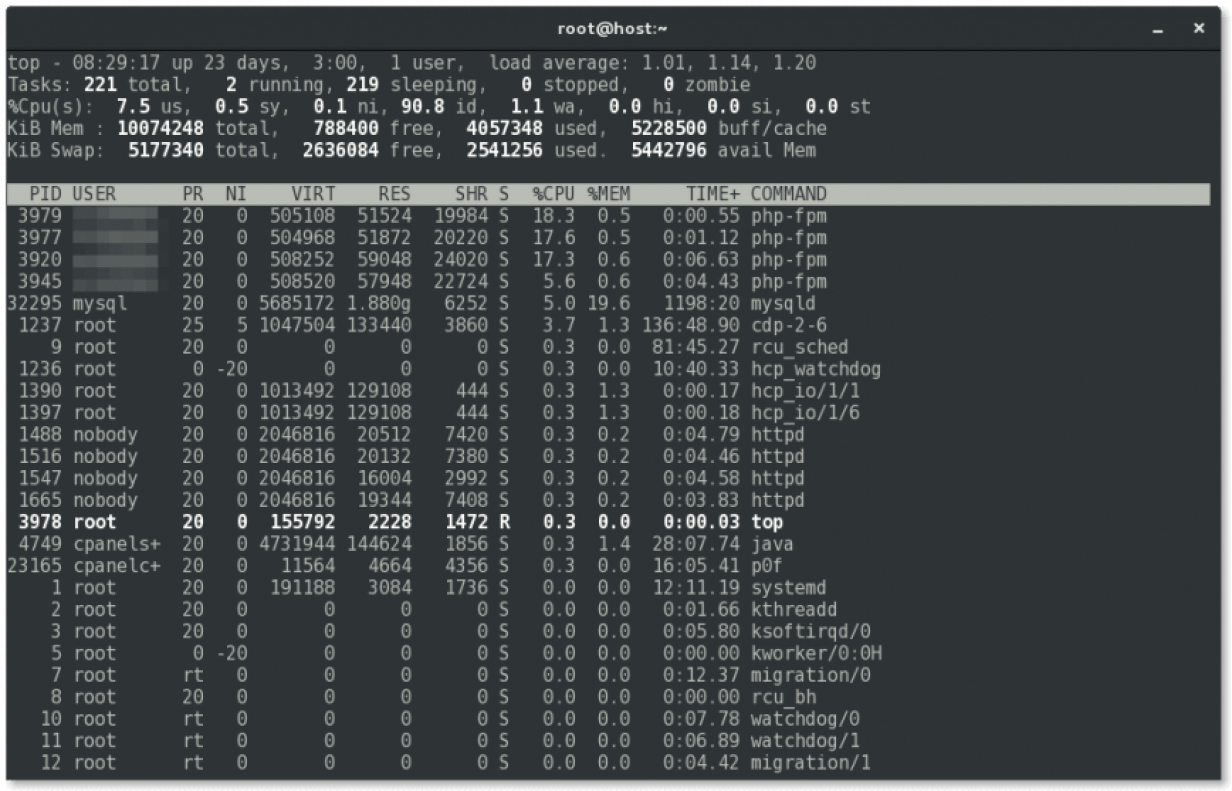
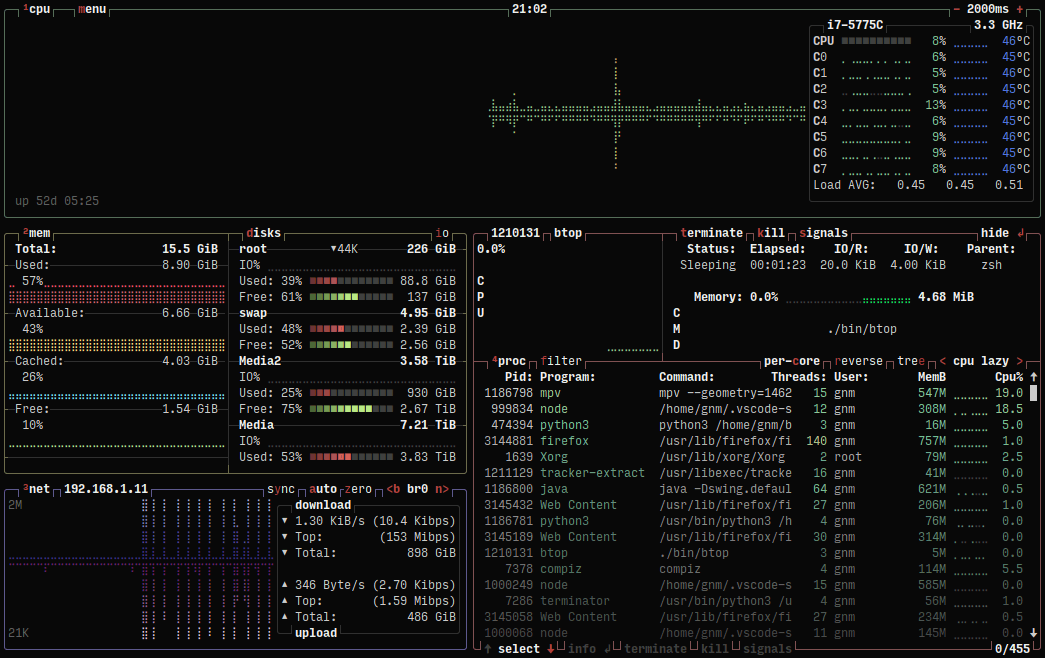
Top is a terminal for system information on Linux. Essentially it is Windows Task Manager but for Linux systems. Similar to the Performance tab in Windows, but text-only.
It provides real-time monitoring of system processes, resources and performance, each offers you different levels of style depending on your baseness, crackness and underlying levels of rizz you exhibit.
top comes pre-installed on most Linux systems. It is basic and lightweight telling you a quick rundown of processes.

sudo install apt htop
htop is a more user-friendly version of the default top command with an interactive and colorful interface.
sudo install apt btop
btop is even more modern than htop with a graphical and interactive UI. It adds visual representations for CPU, memory, disk and network data.

sudo install apt atop
atop is more focused on detailed, long-term system monitoring. It can log system data over time, making it useful for diagnosing past issues.
What about more advanced or specialised monitoring in Linux?
glances is similar to htop but focuses on being more of an all-in-one monitoring tool.
nmon focuses on performance analysis, it’s often used by system admins for in-depth monitoring.
procps is useful for basic checks without needing a full-fledged task manager; it has a collection of small command-line tools (ps, top, free, uptime) for monitoring processes and system status.